
Better than a birds-eye-view, Taranis insights deliver the agronomist-view, helping growers and their retailer partners identify and pinpoint field issues and inconsistencies, so the team can hone in on the missed management opportunities or equipment malfunctions at the root of the problem.
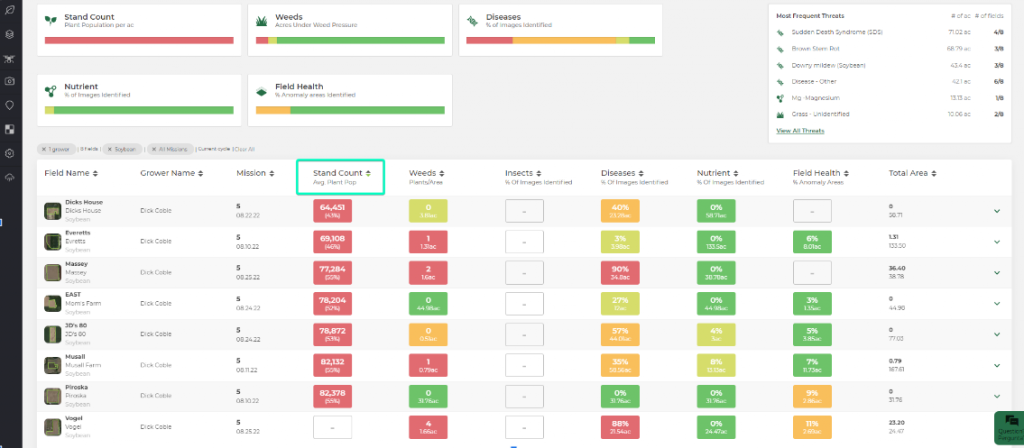
“The grower knew that it was bad, but he didn’t know it was that bad,” stated Customer Success Manager, Katie Staton, of the information Taranis’ stand count dashboard feature provided.
“If you look at the stand count column on the dashboard, all the populations calculated are below threshold for optimum yield—there’s nothing that went above expected or even near expected population planted,” she shared noting the dashboard’s red color-indicated alert showing that stand counts were not what they should have been given the known planting population.
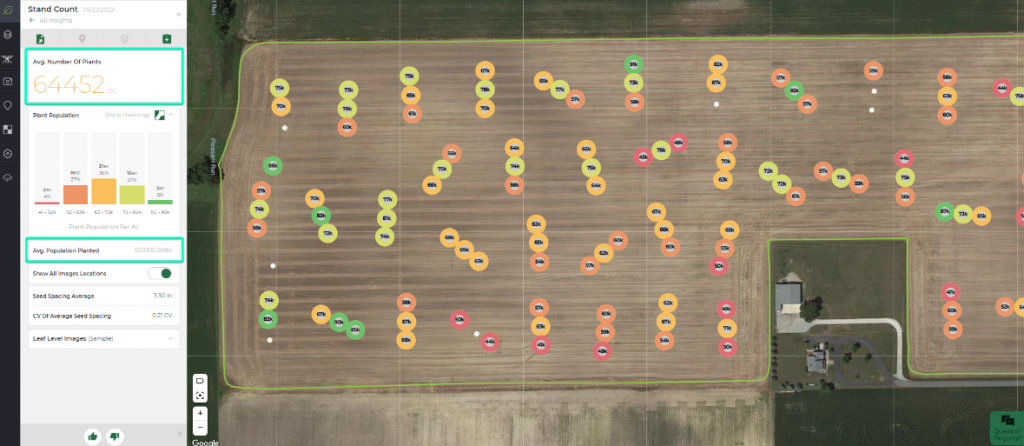
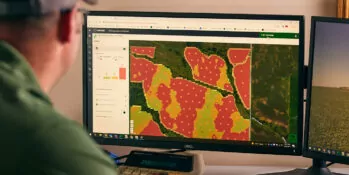
The leaf-level insights in the dashboard showed actual in-field distribution and emerged population to be an overall average of 64,000 plants (versus the targeted 82,000 to 92,000 plants per acre). More troubling, the histogram distribution, made up of the five-bar graph that ranges from dark red to green, showed that the majority of the population was in the dark orange/orange range.
“Imagine servicing tens of thousands of fields with everything planted at the same time. The planter tells you what it thought it did…when we can see exactly what happened. In this case, we could see that the majority of this growers’ fields had a mechanical issue to resolve before the next growing season,” said Staton.
“Through automated imagery analysis, the retailer and grower were able to determine that even though the planter monitor indicated it was dropping the targeted population, there were in fact fewer seeds in the ground and therefore fewer plants emerged in the less than ideal conditions,” she said. “There’s always the potential for those seeds to not be germinated, but when the grower or the agronomist actually digs and doesn’t find the seed, it’s a good indication that the planter isn’t dropping what it says it is.”
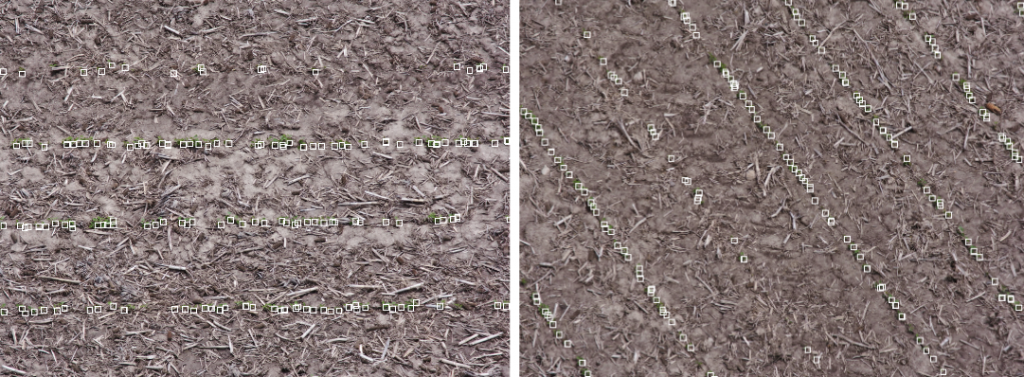
Poor stand
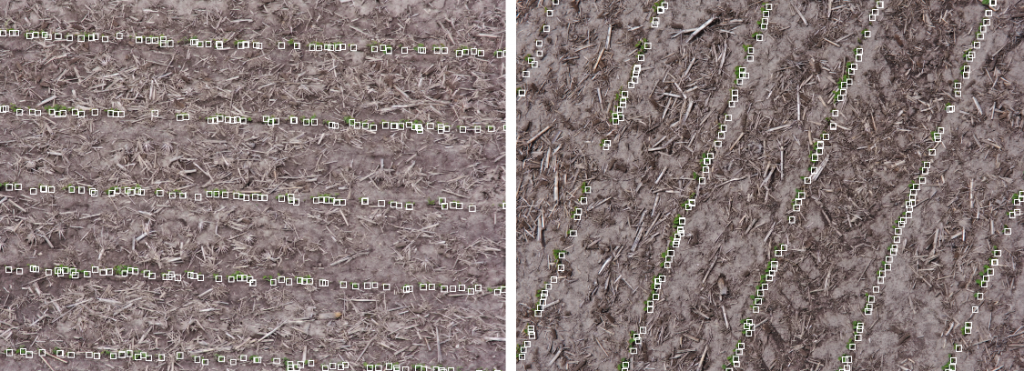
Good stand
With the high resolution of the Taranis imagery and the precision of the algorithm, the exact number of plants in the field was delivered to the farmer. The images above show the difference between a poor stand count and a good stand count. It’s easy to see the spacing of live plants within the row in the field with the good stand count.
“When so many acres are falling below expected, that’s typically an indication of a replant for those specific areas. But, because this farmer’s planter was telling him one thing and the Taranis imagery was telling him another, he was able to investigate. He actually went into the field and dug for seeds that may not have been germinated. He didn’t find anything, so made the choice to replant everything. He knew that his planter was getting some age on it, so he went ahead and ordered a new planter for #plant23—all because of our stand count insight,” added Staton.
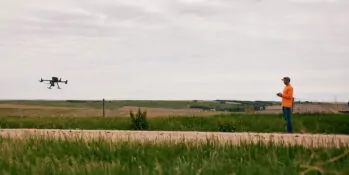
Welcome to the third and final blog in the series about AI in Agriculture, inspired by the white paper Agriculture and Artificial Intelligence: How to Effectively Implement AI in Precision Agriculture.
In this blog, we will focus on the singular aspects of the agriculture industry that make the application of AI methodologies more complex than in other industries.

This is the first blog in a series where we will discuss AI technology and how to apply it to Precision Agriculture methodologies and how, ultimately, AI can take your farm to a new level of efficiency and prosperity.